Mark as Spam
Over the past 3 weeks we have more than tripled the number of users on SciCast. Hooray! But with growth comes growing pains, one of which is an increased amount of spam in our comments. Best as they try, certain people just can’t resist writing complete nonsense in to a discussion thread. So we’ve introduced a way for the better citizens of SciCast to mark a comment as spam:
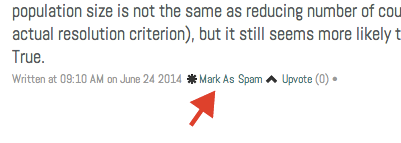
A comment must be marked as spam a certain number of times by multiple people. If it is, it will be hidden from the comment thread. So please do your duty and if you see something that’s clearly spammy, mark it. If you’re unsure, ask us about it.
Another change to commenting is the requirement to have verified your email address before you can comment. Currently we do NOT require an email address to sign up and begin participating in SciCast. But a quick survey of “spam” discussion items revealed that many of those comments were tracing back to people who did not provide an email address as part of their registration. We still aren’t requiring a valid email address to register, but we are to make a comment. We hope this too cuts down on spammy comments.
Recurring Forecasts
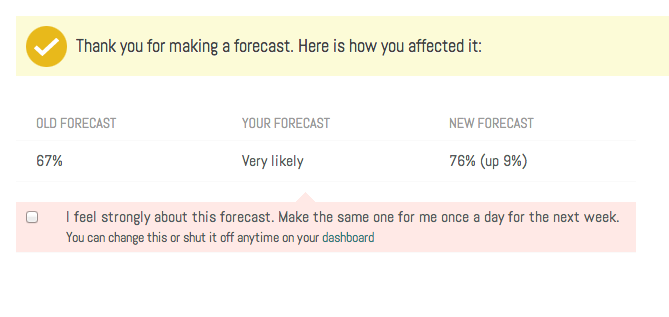
An even more substantive change we’re excited about is “recurring forecasts.” If you ask SciCast to, we will make a forecast for you once a day in a given question based on an initial forecast. So if you use Power Mode to raise the chance to 75%, you can spend a certain number of points to raise it to 75% whenever the once-a-day check finds it below that threshold. If you used Safe Mode, we’ll simply make that same forecast for you for 7 days in a row (or for however many days you specify) using the usual Safe Mode rules.
Here’s an example:
Let’s say I made a forecast that it’s “Unlikely (20%-40%)” that “The same machine will hold the #1 rank on the Top500 and Graph500 lists in August 2014.” Once I’ve completed the forecast, I can ask SciCast to make the same forecast for me once a day for a week, by checking the box.
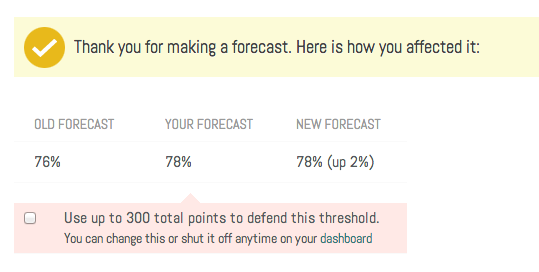
If I’m forecasting in power mode, each edit can be much bigger (and more expensive), so instead of #days, I specify a total budget. The power-mode forecast could use it all in one day, or it could last for months, depending on how much each edit costs:
The values “1 week” and “300 points” are just defaults. I can use “My Dashboard” for more control. Here “My Dashboard -> My Activity -> My Questions” shows me the most recent forecast I made on each question, and offers me a customizable way to make it recur.
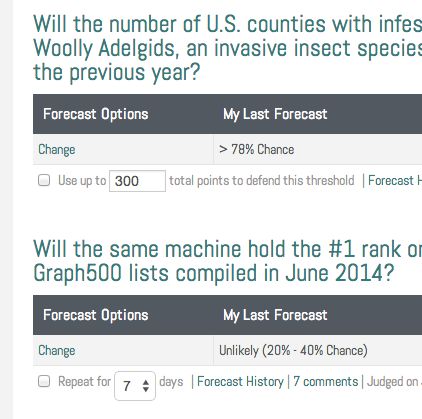
In the figure above, my last Adelgid forecast used Power Mode, so it offers me the option to make “>78%” a recurring edit, for however many points I want. My last Graph500 forecast used Safe Mode, so it offers me the option of a recurring Safe Mode forecast, for a specifiable #days (currently 1-7 only).
Recurring forecasts are tracked in your forecast history and marked as such so you can keep track of what was the original forecast and what was recurring. Use “My Dashboard -> My Activities -> My Recurring” to see and cancel them.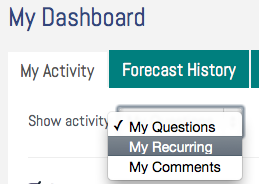
Next Steps
Please let us know how you like these new features. We’re continuing to work on a better commenting system and even more powerful and efficient forecasting tools, and this release is an important first step down that path.