The market is better calibrated than we thought, but not perfect. In our previous calibration post, each question counted once. In the chart below, each forecast counts once, which is the usual method.

Users who have LIKED this post:

The market is better calibrated than we thought, but not perfect. In our previous calibration post, each question counted once. In the chart below, each forecast counts once, which is the usual method.
Users who have LIKED this post:
Prediction market performance can be assessed using a variety of methods. Recently, SciCast researchers have been taking a closer look at the market accuracy, which is measured in a variety of ways. A commonly used scoring rule is the Brier score that functions much like squared error between the forecasts and the outcomes on questions.
One of our active forecasters requested more information about the cluster analysis for the HPV-related questions on SciCast.
The U.S. CDC reports that human papillomavirus (HPV) is the most common sexually transmitted infection in the U.S. Because some types of HPV are initially asymptomatic but increase the risk of cancer, particularly cervical cancer in women, great effort has been put into vaccinating the population against it. Two HPV vaccines have been introduced since 2006, and the CDC encourages their use for girls age 11 and older.
Studies of HPV initially focused on the 13- to 17-year-old population, and the CDC estimates that 53.8% of U.S. females aged 13-17 had been vaccinated with at least one dose of an HPV vaccine in 2012, a gain of 0.8% since 2011. The vaccination coverage varies widely across U.S. States, but some States are similar. Therefore instead of linking each State to the US average, we put them in clusters.
Clusters of States were created by first analyzing variables that correlate with HPV vaccination coverage in 2011 and 2012. A simple model using those variables for predicting HPV vaccination coverage explained over half the variation among states. To view the state-level variables, including HPV vaccination coverage estimates, open this Google Sheet.
On the most useful variables, states in a given cluster are more similar to each other than to States in other clusters. To create the clusters, I used the mclust and cluster libraries in R statistical software to try several forms of cluster analysis. Results varied somewhat, and we chose to use the five clusters that were relatively easy to interpret and each contained a reasonable number of States.
The link structure on SciCast is a simple hierarchy:
That means you can forecast cluster rates given US rates (or vice versa), and a State’s expected rate given it’s cluster’s rate. (Because States are modeled as scaled continuous questions, you cannot forecast cluster given State.)
Based on our model, we have set initial marginal distributions for all 5 clusters, and an initial conditional distribution of Cluster given the the US is in the most likely state. Both are approximately Normal, with the conditional distribution having smaller variance.
Although state HPV vaccination likely is dependent on the cluster to which the State belongs, we do not have a very clear model of the relation between a specific State’s vaccination and its cluster’s vaccination rate. Forecasts of a State rate given its cluster need to be filled in by users with the “Related Forecasts” section after a forecast on a cluster question (Even a forecast that completely agrees with the current market forecast will open up conditional forecasting options.). Hopefully the statistics in the file will help forecasters devise their own ideas!
by Ken Olson
By March 31, SciCast had 5425 forecasts, 1375 users, and 444 questions.
The graph below (click to enlarge) shows some user activity statistics through the end of March. Registrations have leveled off, but the number of daily forecasts per active user is rising. Since January, the average number of forecasts per day among people who make comments and forecasts on SciCast questions has roughly doubled (from 2.5 to 5).
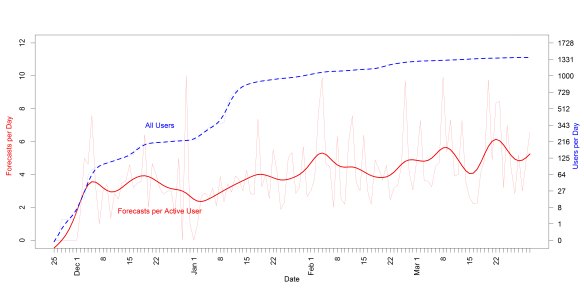
The number of registered users has increased over the same time frame, but most registration occurred early in the year. We had about 800 new users in January but only about 200 new users in both February and March. April will see some new outreach campaigns and incentives.
Please help the SciCast team by encouraging other people to join in our forecasting challenge. Our crowdsourcing approach to predicting science and technology benefits from having a crowd to forecast on every question.
The more competitive users might like to take advantage of the daily and weekly cycles in forecasting. Timings show we still have a strong U.S. bias: few forecasts occur during our night, but mornings also have fewer forecasts than afternoons and evenings. There are roughly half as many forecasts each hour from 07:00 to 11:00 as there are each hour from 11:00 to 19:00. (All times U.S. Eastern, GMT-5/4).
Weekends also have slightly fewer forecasts. There are four forecasts per day on Saturday, Sunday, and Monday for every five forecasts per day on Tuesday through Friday.
by Ken Olson
Did you like this post? Follow us on Twitter.
By Dr. Ken Olson
Have you explored Related Forecasts yet? The SciCast Team frequently adds new questions and new links between questions. The links create clusters of related questions supporting “what-if” forecasts. We will be showcasing some of those here on the blog.
For example, below we see part of the network linking three clusters of questions: Arctic sea ice, the GBO-4 biodiversity reports, and the Pacific sardine population.
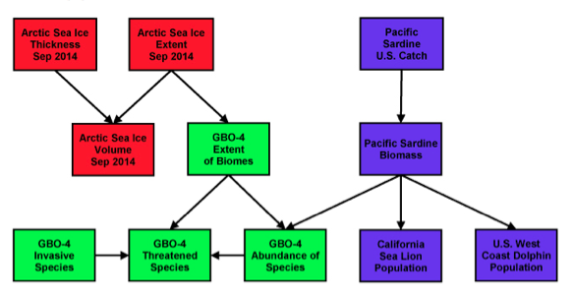
An arc (an arrow leading from one question to another) indicates that we think the outcome of one question might influence the other. Questions connected by arcs will usually appear in each other’s “Related Forecasts” section. For example, “GBO-4 Biomes” will appear for “Arctic sea ice extent” and vice versa. Your biome forecast can depend on sea ice extent: presumably a loss of sea ice reduces that biome.