For the flu forecasting challenge (https://scicast.org/flu) participants are required to predict several flu season characteristics, at national and at regional levels (10 HHS regions). For some of the required quantities — such as peak percentage influenza-like illness (ILI), and total seasonal ILI count — one may argue that national level values have some relationship with the regional level ones. Or, in other words participants may be led to believe that national level statistics can be obtained from regional level ones.
To better explore the support for such intuitions we looked at three specific questions:
- Are there discrepancies between sum of regional weekly ILI case counts and the national weekly ILI case counts?
- Can we find bounds that specify the difference between national flu season total and sum of regional flu season totals?
- Can we find bounds that dictate the difference between national flu season peak and the regional flu season peaks?
ILI Totals
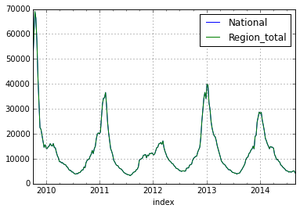
The good news for question 1 was that the weekly sum of regional level ILI case counts were found to match exactly with the weekly CDC ILI case counts as shown below:
However, a unique feature of this prediction problem is the fact that the national and regional seasons (start, peak and end dates) are determined independently of each other. As a result, the seasons don’t align exactly between the different regions and with the national level. Consequently, quantities such as total ILI case counts for the national level season differ when calculated directly from the National curve (the correct way) than when it is calculated by aggregating the individual regional level ILI season case counts (the incorrect way).
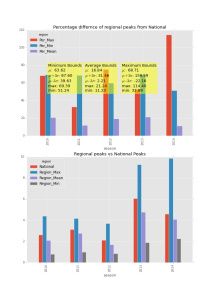
Below, we investigate this error for the past 5 seasons (2009-10 season is indexed as 2010 and so on) and find the mean, standard deviation and 95% confidence bounds for the percentage absolute relative difference:
ILI Peaks
Similarly we analyze the differences between the peak value for the national curve with those for the regional curves. These values are principally different as the peaks can in general correspond to different dates and the deviations are shown in the top part of Figure 3. We analyze three different ways of comparing the regional peaks to the national one:
- Compare National Peak with the maximum Regional Peak for the season
- Compare National Peak with the minimum Regional Peak for the season
- Compare National Peak with the average Regional Peak for the season
For example, the maximum regional peak is ~70% different from the national peak for 2011. The minimum and the average of the regional peaks differ by ~35% and 14% for the same period. Overall the average of the regional peaks shows the least deviation from the national peak and can be thought of the best estimator among the three investigated here.
For the sake of completeness we also plot the absolute value of the three estimators so discussed above with national peak in the bottom part of Figure 3.
As is evident from Figures 2 and 3, the regional level peak and total ILI season values don’t provide mathematically consistent estimates of the corresponding quantities at the national level . However, the mean and deviations as presented in these two Figures can still be used to perform sanity checks between regional level predictions and the national level one. These can also arguably be used to come up with a constrained optimization framework for the overall challenge.
Editor’s Notes:
Prithwish Chakraborty is a Graduate Research Assistant at Virginia Tech’s Discovery Analytics Center, and a member of the “EMBERS” team. Prithwish helped design the SciCast Flu Trends questions to test the potential for combining statistical models (see his 2014 paper) with prediction markets.


We will shortly be linking the ILI Peak Percentage questions in a simple Naïve Bayes structure (National Peak Percent) -> {Region1, Region2, …, Region10} peak percents. However, because these are Scaled questions, combo edits are only available through the API. Without a custom widget for conditioning on Scaled, forecasters have to manually mix conditioning on peak percentage being “False” (at the low end of the range) and “True” (at the high end). This is too confusing to non-experts so it’s disabled in the GUI. However, it is available in the API.
The 10 regional ILI peak percentages have each been linked to the national peak percentage. They remain uncorrelated until forecasters expert enough to use the API start correlating them. (I’m looking at you @jkominek.) I’d suggest starting with a weak regression model for each region, R_i ~ N(R_0 + delta_i, sigma_i). I’d like to do that myself but suspect I won’t have time. Also, it’s probably better to use a fat-tailed distribution.