by Kellen Leister
Note: The following post has been revised slightly to use a power law (x^k) instead of a logarithmic function (k ln x). This is because the logarithmic function could go negative, which we know the percentage of trades cannot do. Revisions are in red.
Given the ease of switching back and forth between Safe Mode and Power Mode, we were interested to observe the relative use of each mode. (For a description of the different modes, see the Appendix.)
Use of Safe Mode turns out to be highly negatively correlated with experience: the more trades a user has made, the less likely he is to make them in Safe Mode. There are prominent exceptions to this rule, such as the user who has made over 4200 trades (third highest number of trades), all but nine of which are in safe mode. If we plot the percentage of trades made in safe mode among the Nth trades made by users who have made at least N trades, we obtain the graph shown in Figure 1:
Figure 1. Percent of Trades in Safe Mode vs Previous Number of Trades by User
Up through the 1000th or so trade, the curve fairly closely follows a logarithmic power law pattern. Fewer than 30 users have made that many trades, though, so the graph can be significantly affected by just a few users above that level. For instance, if we disregard the trades for the 4200+ trade user discussed above, the R-squared fit of the logarithmic power law curve jumps from .5675 to .8478 .3659 to .4527, as shown in Figure 2.
Figure 2. %Safe-Mode Trades vs Previous Number of Trades by User, Excluding 1 User
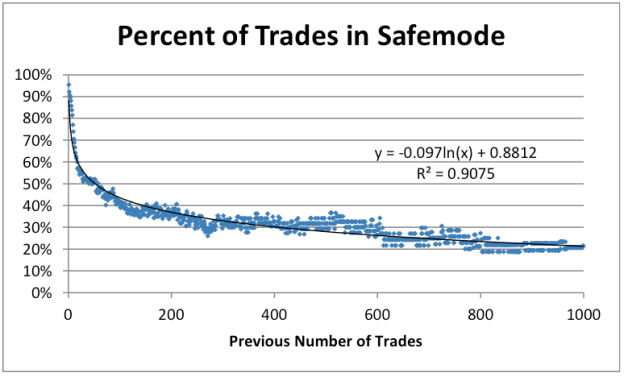
While the majority of trading volume occurs among the small number of traders who have made thousands of trades, the vast majority of users have made few trades (90% of those who have made a trade have made eight or fewer trades). Also, users’ trading habits likely develop a pattern that does not change significantly after a large number of trades. For these reasons, if we focus only on the 1000th or less trades of a user (see Figure 3), we can capture the developmental pattern of most all the users.
Figure 3. Percent of Trades in Safe Mode vs Previous Number of Trades by User Excluding 1 User
The logarithmic power law fit in this section of the curve now increases to .9075 .8892.
To provide additional insight into these charts, consider a few statistics: fewer than 10% of users who have traded have ever made a power mode trade. Yet, power mode trades represent almost 60% of all trades made. Of users who have made at least one power mode trade, the average user makes nine safe mode trades before his first power mode trade. 69% of these users never make a safe mode trade again. The stickiness of power mode is consistent with the steadily decreasing percentage of trades made in safe modes as users gain experience.
Appendix: SciCast Trading Modes
Trading in SciCast can be accomplished via three alternative modes:
- Safe mode - permits users to select one of seven belief ranges like “0-10%” or “40-60%”; the system then makes a relatively small point-value trade in that direction, up to half-way.
- Login to SciCast to take Training Courses (Click Training)
- Why Did My Forecast Do That?
- More posts about Safe Mode
- Tutorial Index
- Power mode - permits users to select the exact percent to which they change a probability
- API mode - permits users to operate “bots” that observe the market and are programmed to mimic the user’s beliefs and make trades on specified questions according to their chosen strategy. (On multi-choice questions, bots can fully specify the chances of each outcome).
When new forecasters first visit SciCast, they are offered sample questions and encouraged to make forecasts. The default mode is Safe Mode, but it is easy to switch to Power Mode, and back. Forecasters can also make Power Mode their default.
API mode is only for scripting. Very few users use API mode, though it is a very high percentage of trades made by most of those who do use it.


Pingback: Revision: Analysis of SciCast Safe Mode Usage | The Official SciCast Blog