By March 31, SciCast had 5425 forecasts, 1375 users, and 444 questions.
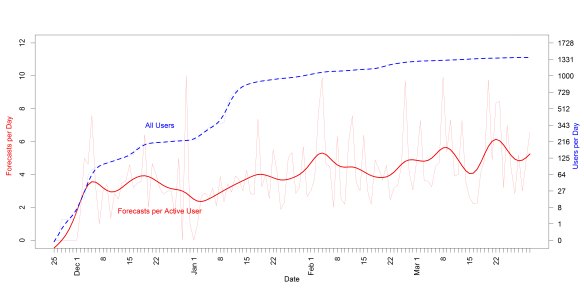
The graph below (click to enlarge) shows some user activity statistics through the end of March. Registrations have leveled off, but the number of daily forecasts per active user is rising. Since January, the average number of forecasts per day among people who make comments and forecasts on SciCast questions has roughly doubled (from 2.5 to 5).
The number of registered users has increased over the same time frame, but most registration occurred early in the year. We had about 800 new users in January but only about 200 new users in both February and March. April will see some new outreach campaigns and incentives.
Please help the SciCast team by encouraging other people to join in our forecasting challenge. Our crowdsourcing approach to predicting science and technology benefits from having a crowd to forecast on every question.
The more competitive users might like to take advantage of the daily and weekly cycles in forecasting. Timings show we still have a strong U.S. bias: few forecasts occur during our night, but mornings also have fewer forecasts than afternoons and evenings. There are roughly half as many forecasts each hour from 07:00 to 11:00 as there are each hour from 11:00 to 19:00. (All times U.S. Eastern, GMT-5/4).
Weekends also have slightly fewer forecasts. There are four forecasts per day on Saturday, Sunday, and Monday for every five forecasts per day on Tuesday through Friday.
by Ken Olson
Did you like this post? Follow us on Twitter.

