Check out the latest updates to SciCast Predict. As always, we welcome your feedback.
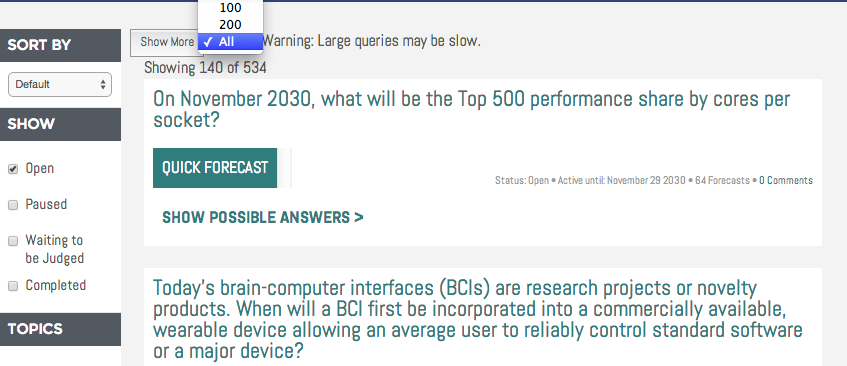
1) New “Show All” capability and enhancements made to “Show More”
2) New stepwise trend graph
3) Improved network visualization of questions
The local network view (default) now shows the whole connected subnet, not just the immediate neighbors. The active question is orange, and you can select a new active question by clicking. Light gray dots are closed questions. Black dots are still active.
The full network is still available by clicking “Show full network.” In this view, roll over any item to see the question name.
4) Forecast impact display: if your forecast affected other questions enough to create a shadow forecast in their history, then we show them with big pulsing dots in the subnet containing the active question. (The active question is the small orange one.)
Impact graph: your forecast on Paypal noticeably affected the GoogleWallet and the 150K transactions questions, but not the others.
Users who have LIKED this post:


i really like the new graphs. it feels easier to discern fine detail in them.
Users who have LIKED this comment:
Woohoo!
Users who have LIKED this comment: